plt.chat
Describe the plot.
Keep the code.
Upload a data file and describe the chart you want — matplotlib code appears, plotting locally in your browser. No server-side execution, no uploading your dataset. Every tweak is a shareable, forkable version.
Join the waitlist for early access and free token packs at launch. No spam — one email when we're live.
See it in action
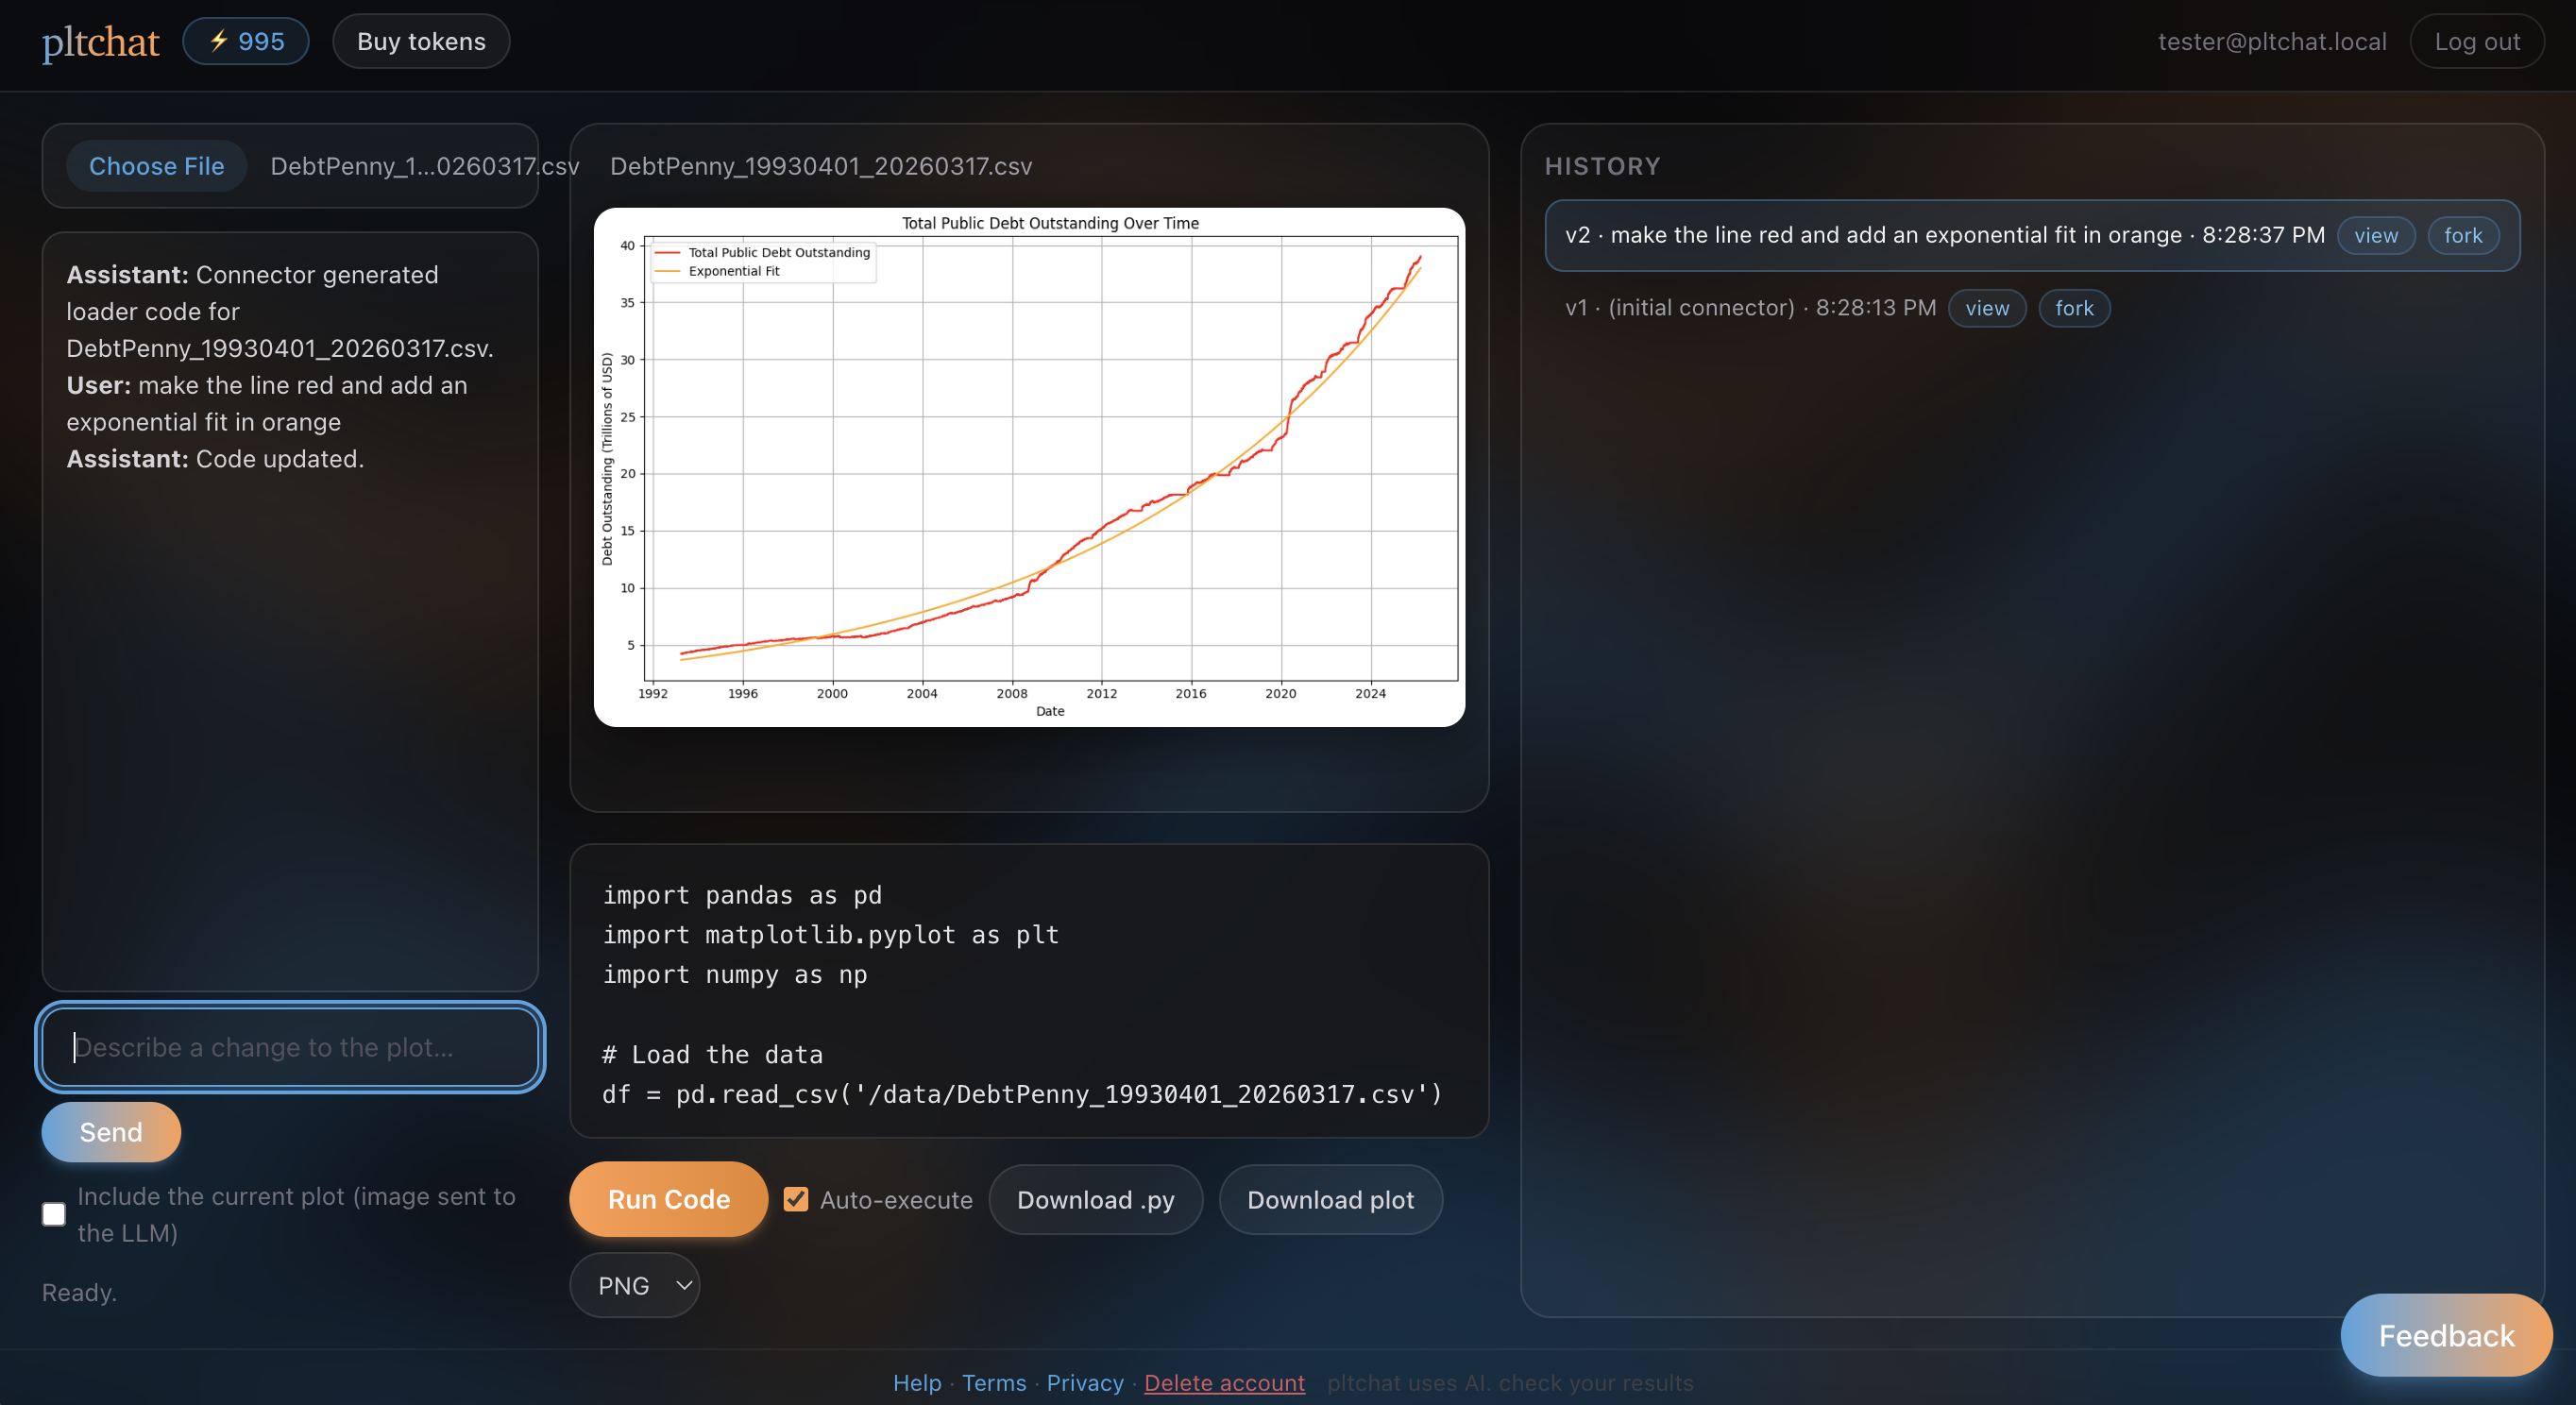
Chat on the left, live plot in the middle, forkable history on the right — the matplotlib code is always yours to edit and keep.
How it works
1
Upload a file
CSV, TSV, JSON, XLSX or Parquet — up to 50 MB. The first plot appears automatically once the Python environment loads in your browser.
2
Refine by chatting or in code
“Make it a bar chart.” “Log scale on y.” “Only 2024 rows.” Each message tweaks the matplotlib code or change the code directly.
3
Keep the result
Download the plot as PNG, SVG or PDF — and the code as a .py file to reproduce it anywhere.
Why it's different
Runs in your browser
Plotting code executes via Pyodide — zero server-side execution. Only a small sample of your data (column names, types, first rows) is sent to the LLM that writes the code.
Every change is a version
The History panel keeps every iteration. Roll back to an earlier plot or fork it into a new project without losing the original.
The code is yours
The generated Python is fully visible and editable. Edit it directly, run it with Ctrl+Enter, take it with you — no lock-in.
Say it in plain words
“scatter of price vs area, colored by bedrooms”
“log scale on y”
“only 2024 rows”
“make it a stacked bar chart”
“title: Revenue”
“downsample to 10k points”
Ready to chat with your data?
Early access and free token packs at launch. No spam — one email when we're live.